The U.S. stock market is extremely expensive, by all measures. Technology companies like Nvidia lead the way, but even the average stock is overvalued in relation to past cycles.
When will there be a correction in the U.S. stock market?
As we approach 2025 the markets continue to surge higher, perhaps not surprising as Wall Street got the President it preferred. But even the most bullish are wondering how good is too good.
Let’s take a look at a few of the most reliable valuation measures and make some guesses about the future.
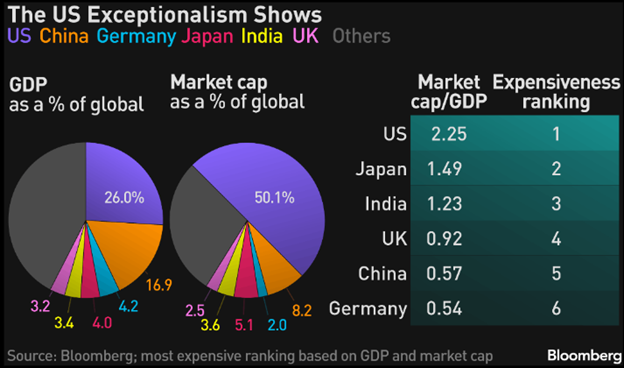
Warren Buffett likes the ratio of market capitalization to GDP to show if the market is cheap or expensive.
He said in 2001, “If the relationship between market cap and GDP falls to the 70 to 80 percent area, buying stocks is likely to work very well for you. If the ratio approaches 200 percent – as it did in 1999 and a part of 2000 – you are playing with fire.”
This stock market is really, really expensive at 225 percent of GDP (2.25 ratio).

Buffett’s Berkshire Hathaway has been selling stocks steadily, and now holds $325 billion of short-term U.S. T-bills, more than 30 percent of the portfolio. This is one of the highest levels of cash he’s ever held in more than sixty years.
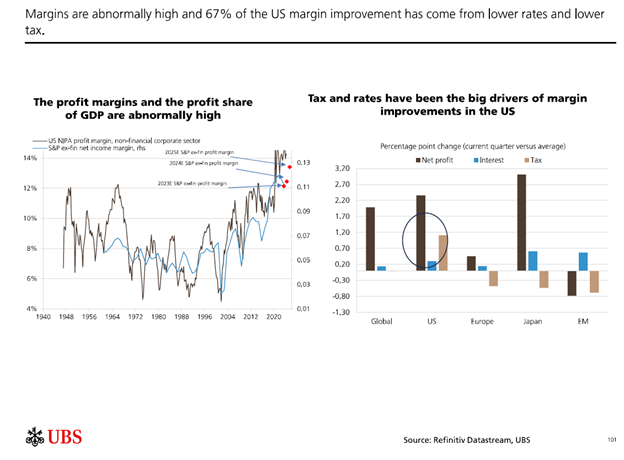
Net profit margins are a reliable yardstick but can get stuck at extremes for years. They are at unusually high levels:

Two key factors in U.S. profit margins — low interest rates and reduced taxation — could be reversing soon.
Interest rates have already increased to 7.75 percent on the bank prime rate, up substantially from the bottom when rates went below 4 percent. This higher cost of interest must be hurting earnings already.
Taxation is more complicated as the Trump 1.0 brought major cuts in corporate income taxes. In 2017 taxation rates for corporations were reduced from 35% to 21%, but those temporary cuts will expire next year unless extended. Trump promised to lower the rate even further, to 15 percent. But Congress may not pass a cut, or even an extension of the 2017 cuts, given a deficit projected at $2 trillion.
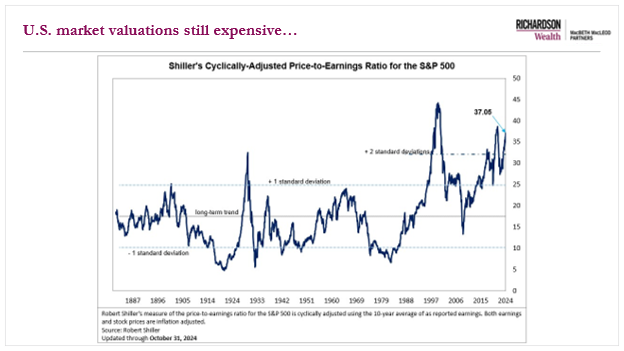
The Shiller CAPE (Cyclically Adjusted Price to Earnings Ratio) shows that markets are as expensive as they ever get, comparable to 2000 in the dotcom era and similar to 1929 and the Japanese stock market of 1989 (not shown).

Source: Dr. Robert Shiller, Yale University
This measure has been accurate through crashes, wars, depressions and stock market bubbles. The CAPE shows the market has been in a major bubble for a decade.
This chart shows that buying stocks when the CAPE is greater than 2 standard deviations from the mean is a bad bet. Returns have always been below average for several years after such peaks.
Unfortunately, the Shiller CAPE is less useful as a short-term timing indicator since it is based on a 10-yr average.
While these measures show this market is overdue for a large correction, we cannot say when.
Hilliard MacBeth
The opinions expressed in this report are the opinions of the author and readers should not assume they reflect the opinions or recommendations of Richardson Wealth or its affiliates. Assumptions, opinions and estimates constitute the author's judgment as of the date of this material and are subject to change without notice. We do not warrant the completeness or accuracy of this material, and it should not be relied upon as such. Before acting on any recommendation, you should consider whether it is suitable for your particular circumstances and, if necessary, seek professional advice. Past performance is not indicative of future results. The comments contained herein are general in nature and are not intended to be, nor should be construed to be, legal or tax advice to any particular individual. Accordingly, individuals should consult their own legal or tax advisors for advice with respect to the tax consequences to them, having regard to their own particular circumstances.. Richardson Wealth is a member of Canadian Investor Protection Fund. Richardson Wealth is a trademark by its respective owners used under license by Richardson Wealth.