On Wednesday September 18, 2024, the U.S. Federal Reserve cut 50 basis points off its benchmark rate, making the first move to lower rates in four years.
History shows that economic cycles and stock market outcomes after the first cut are divided. Either this is the start of a deep recession and a stock market correction, or the market and the economy will hit higher highs during this cycle.
Could this rate cut herald the start of an even bigger bubble?
Readers will know there are many signs that the U.S. economy has been weakening over the last few months. Some highly regarded pundits are suggesting that a recession has already started or is about to start.
Unfortunately, there are very few reliable ways to determine if a recession is starting now — we usually find out only after many months if we are heading to new highs or mired in a deep recession.
One very reliable indicator has been The Sahm Rule. Claudia Sahm claimed that if the 3-month moving average unemployment rate goes up by 50 basis points in a 12-month period then a recession is about to start. This event was triggered with the July unemployment reading of 4.3 percent, up from the bottom of 3.5 percent.
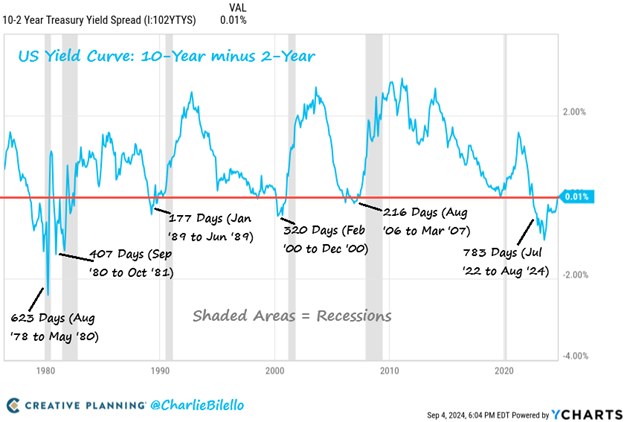
There are several other indicators flashing a recession warning. One reliable predictor is inversion of yield curves on government bonds. The most closely watched yield curve inversion occurs when the yield on the 2-yr government bond is higher than the 10-yr. This inversion was in place for a record 783 days, from July 2022 until early September. The recession usually starts after the yield curve de-inverts with recession shown as shaded vertical bars:

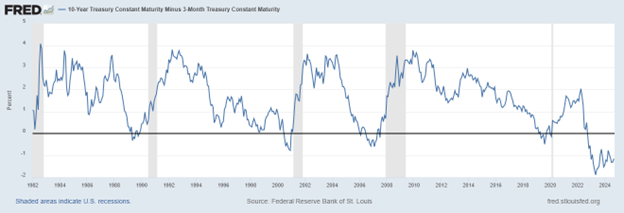
Even more reliable than the 10yr-2yr yield curve is the de-inversion of the 10yr-3 month curve which heralds a recession 78 percent of the time within a year.

The current inversion is still at 1 percent, so for a de-inversion signal we need at least two 50 basis points cuts, or several 25 bps cuts. This could take us into 2025.
The U.S. stock market has a mixed record after the first cut.
In the three rate cuts since 2000 the market has been down 8 months after the first rate cut:
- 16 percent in 2001
- 6 percent in 2007 (the market went down much further in 2008 and ’09)
- 16 percent in 2019
But, before 2000, after a rate cut in 1995 the stock market went up 16 percent and in 1998 the market soared by 24 percent. Those last two were prior to the dot-com market bubble peak in March of 2000. Alan Greenspan, then Fed chair, was hailed as the “maestro” for engineering that soft landing.
So, is today’s rate cut signal similar to 2001 and 2007, leading into recession and a big sell-off in stock markets, or will we see a new multi-year surge in stock markets, with irrational exuberance driven by the AI craze and huge gains in productivity?
Hilliard MacBeth
The opinions expressed in this report are the opinions of the author and readers should not assume they reflect the opinions or recommendations of Richardson Wealth or its affiliates. Assumptions, opinions and estimates constitute the author's judgment as of the date of this material and are subject to change without notice. We do not warrant the completeness or accuracy of this material, and it should not be relied upon as such. Before acting on any recommendation, you should consider whether it is suitable for your particular circumstances and, if necessary, seek professional advice. Past performance is not indicative of future results. The comments contained herein are general in nature and are not intended to be, nor should be construed to be, legal or tax advice to any particular individual. Accordingly, individuals should consult their own legal or tax advisors for advice with respect to the tax consequences to them, having regard to their own particular circumstances.. Richardson Wealth is a member of Canadian Investor Protection Fund. Richardson Wealth is a trademark by its respective owners used under license by Richardson Wealth.