The housing bubble has become enormous in these three countries, and when these bubbles burst, it will be very painful.
Canada, Australia and New Zealand continue to defy the odds as house prices move further into unaffordable territory.
Are these house prices justified?
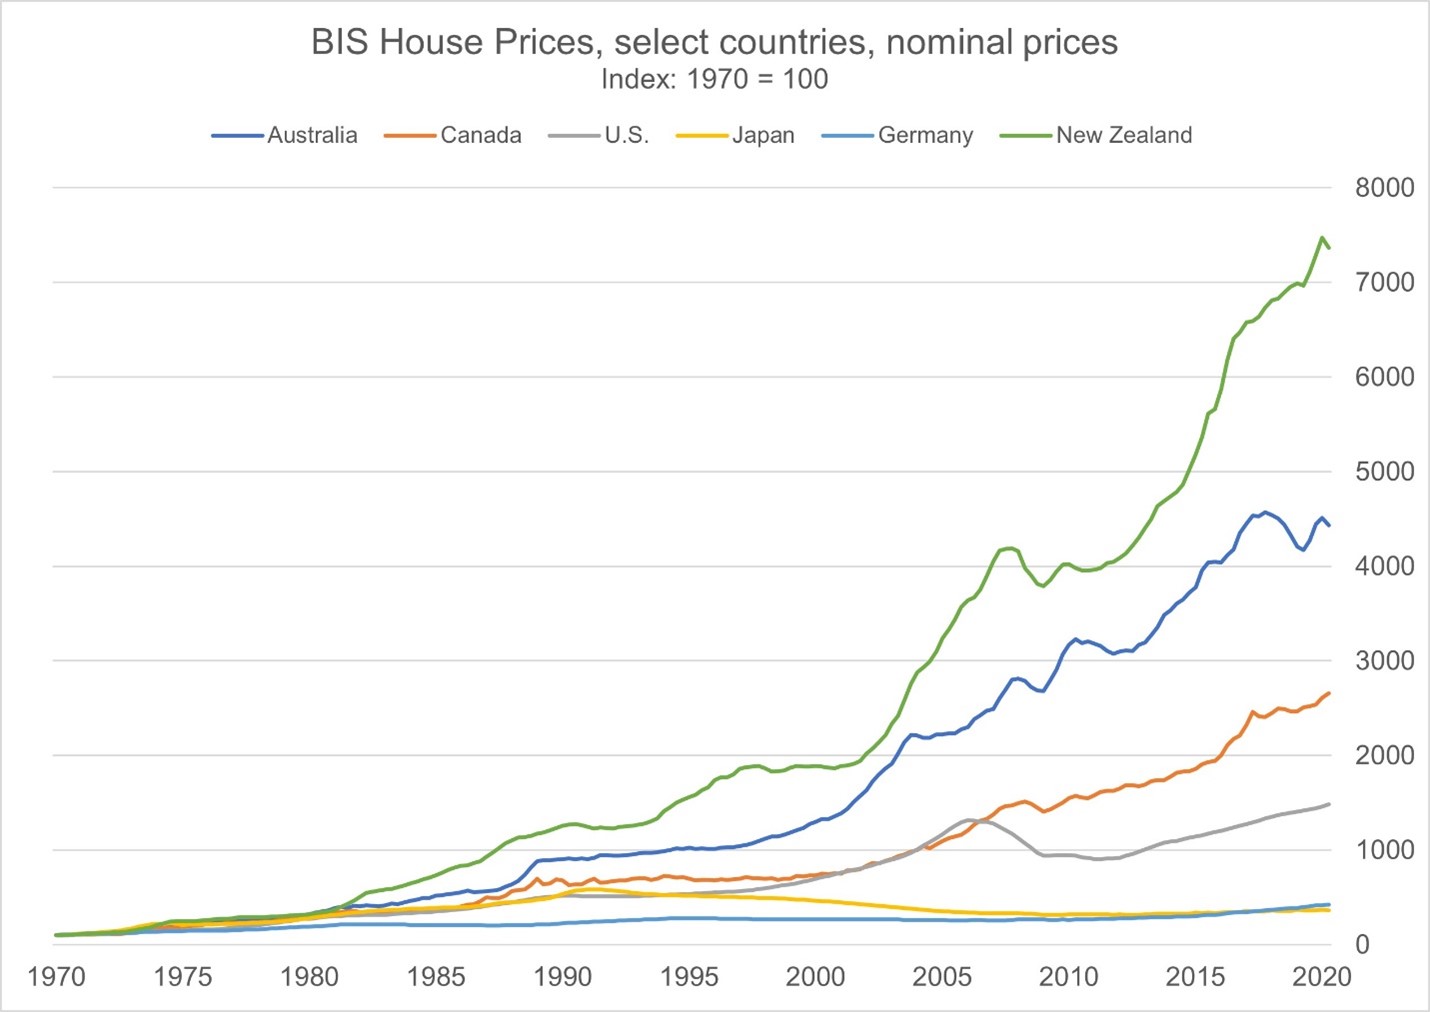
Source: Bank for International Settlements
From 1970 to 2020 New Zealand house prices grew the fastest, going from 100 on the index to about 7,500, growth of 75-fold.
The compound annual growth rate (CAGR) was 9.01 percent for New Zealand, 7.91 percent for Australia, 6.89 percent for Canada, 5.56 percent for the U.S. and 3.2 percent for Germany and Japan. The average inflation rate for the last century has been 3.10 percent.
The excess return in housing above the inflation rate makes life difficult for new entrants to the housing market because wages seldom rise faster than inflation. And in all three countries wages tracked the inflation rate.
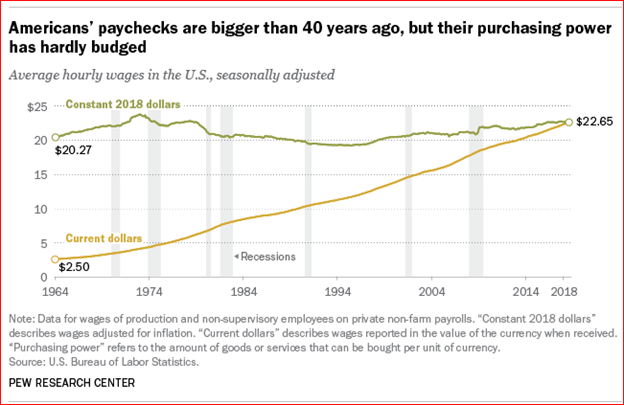
In the more moderate case that includes a housing crash, U.S. hourly wages grew nine-fold from 1964 to 2018 (yellow line) but they barely kept up with inflation with real wages little changed over that 66-year period (green). Even with a 2009 crash house prices grew 15-fold.
Today, most Americans cannot afford to buy the homes they live in if they work for wages.
In Canada, Australia and New Zealand, a larger discrepancy between house prices and wages exists. These three avoided the housing crash that hit the U.S. in 2009 and prices continued to grow at much higher rates than inflation and wages.
Canada showed a lack of growth in wages similar to the U.S.
Although the time frame is a little shorter for Canadian data it is safe to assume that there would be a similar result to the U.S. over the full time period. And there are supporting data from an international study.
Demographia publishes an annual survey (16th version is here http://www.demographia.com/dhi.pdf) that shows housing affordability in many countries, by city, comparing median household incomes and median house prices. Demographia finds that house prices have grown much faster than incomes in the last 16 years, making many cities very unaffordable.
Cities in Australia and Canada consistently challenge for the top spot in unaffordability. Five major housing markets in Australia show as “severely unaffordable” with a multiple of greater than 5.0. A multiple of three is considered the upper limit of affordable for detached housing with lower limits for townhomes and apartments, according to Demographia.
Since Demographia has been publishing this report, “some metropolitan market house prices have doubled, tripled or even quadrupled relative to household incomes.”
Using 2019 house prices and incomes Demographia shows Hong Kong with the highest multiple at 20.8, with Vancouver second at 11.9 and Sydney, Australia a close third at 11.0. Toronto and Auckland, New Zealand are in a tie for sixth place at 8.6.
San Jose, San Francisco and London, England are not far behind at 8.2 to 8.5 times. Here is an excerpt showing the least affordable cities:
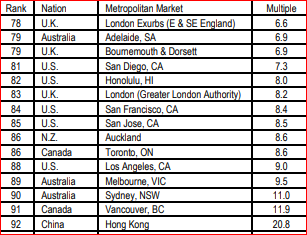
Source: Demographia 2020
Of the seven least affordable cities, five are from Australia, Canada and New Zealand, confirming what was shown on the chart above.
Is there a reason for these cities to be so unaffordable? In the six years since “When the Bubble Bursts: Surviving the Canadian Real Estate Crash” first appeared I have heard many justifications for high prices in Canada. High rates of immigration, world class city status, foreign investor demand and many other tropes are repeated.
But none of those narratives justify such high prices, in my opinion.
These countries are in a major housing bubble and it is ready to burst.
Hilliard MacBeth
The opinions expressed in this report are the opinions of the author and readers should not assume they reflect the opinions or recommendations of Richardson Wealth or its affiliates. Assumptions, opinions and estimates constitute the author's judgment as of the date of this material and are subject to change without notice. We do not warrant the completeness or accuracy of this material, and it should not be relied upon as such. Before acting on any recommendation, you should consider whether it is suitable for your particular circumstances and, if necessary, seek professional advice. Past performance is not indicative of future results. The comments contained herein are general in nature and are not intended to be, nor should be construed to be, legal or tax advice to any particular individual. Accordingly, individuals should consult their own legal or tax advisors for advice with respect to the tax consequences to them, having regard to their own particular circumstances.. Richardson Wealth is a member of Canadian Investor Protection Fund. Richardson Wealth is a registered trademark by its respective owners used under license by Richardson Wealth.