A flattening yield curve, based on the difference between the 2-year and 10-year (or 30-year) US Treasury bonds, contains valuable information about the future.
The recent rapid increase in short-term interest rates means that the short-term rate is catching up to the 10-year rate. The spread between the two is 50 basis points, narrow by historical standards.
Is the shrinking of the spread between the 10-year and the 2-year interest rate giving investors a hint about what will happen next?
The yield curve is inverted when short-term rates are higher than long-term rates. Short-term rates can be seen in the 1 and 2-year maturity while long-term is usually the 10-year or the 30-year. The spread now is about 50 basis points, 2.25 versus 2.75 percent as of March 30.
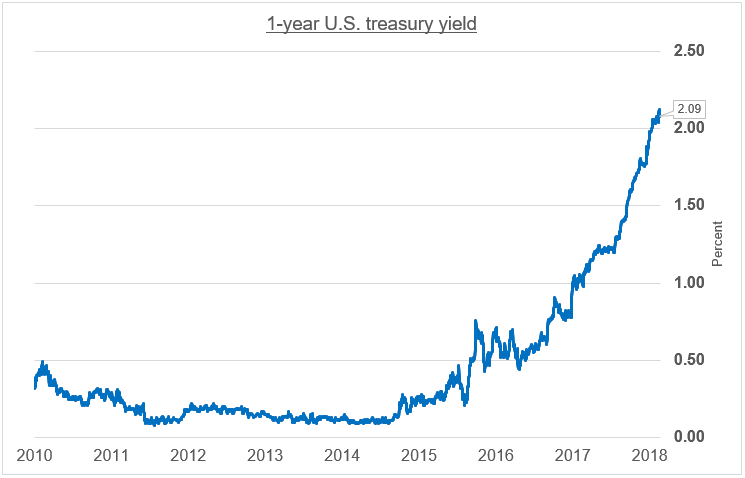
Source: MacroTrends, April 5, 2018
As the 2-year interest rate climbs to nine-year highs, markets are getting spooked. While it could be worries about a trade war, or realization that there’s been nine years since the market lows in March 2009, the US market did poorly (down about 2%) in the first quarter of 2018 while the Canadian stock market did even worse, dropping by about 5%.
As a Bloomberg article states, if the two rates invert a recession usually follows.
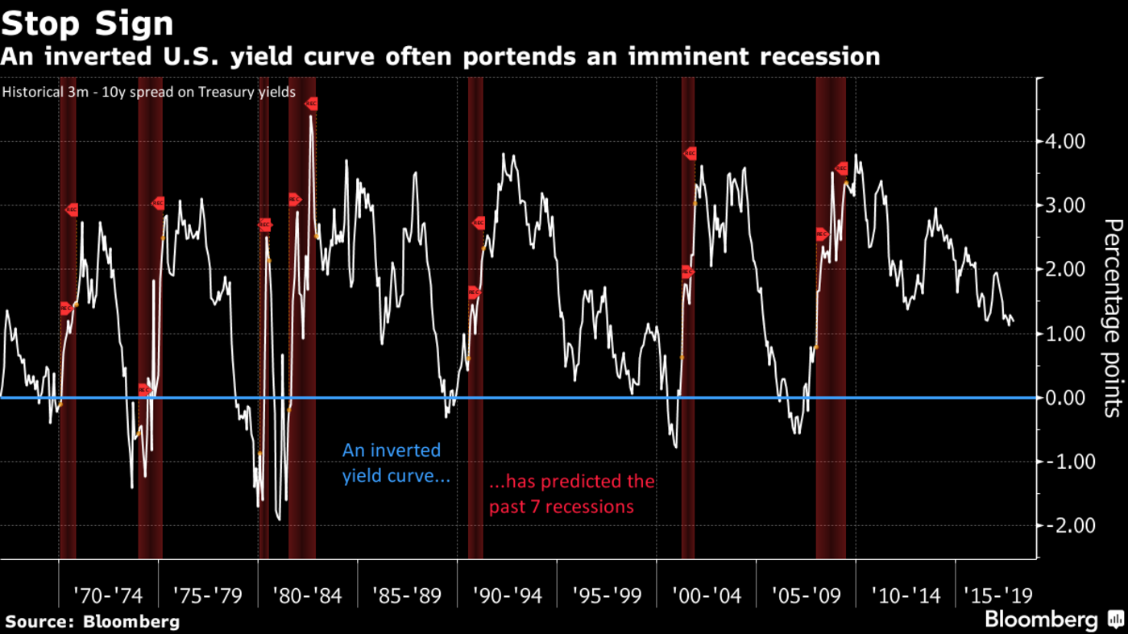
Source: Bloomberg
The article quotes a market strategist:
Peter Cecchini, chief market strategist at Cantor Fitzgerald, calls it “the most important thing to have a clear idea about now.”
The other explanation for the market weakness could be the fact that higher interest rates spook investors. As higher rates loom, due to higher inflation and a more aggressive Fed, investors begin to wonder when it will cause a slowdown in the economy.
Since the Global Financial Crisis, the amount of private sector debt has continued to surge higher and that means there is less room for error as rates rise. At some point, heavily indebted corporations and households will find it impossible to handle the burden of rising rates on their fragile balance sheets.
But most people still believe that rising rates are a sign of a strong economy and don’t necessarily create a problem for markets, unless the yield curve inverts.
The current economic recovery is almost 9 years long, the second longest on record. The longest recovery occurred between December 1990 and December 2000. If the current recovery, which started in March 2009, lasts one more year, it will be the longest ever.
For the best market timing, though, it is important not to wait until the recession starts. The stock market usually peaks before the recession starts, by an average of six months in lead time, according to Andrew Garthwaite, global strategist for Credit Suisse.
Garthwaite points out that the yield curve must invert first to indicate recession. All seven recessions since 1962 were preceded by an inversion of the yield curve, with a lead time of five months on average.
The most likely reason for rates inverting would be higher short-term rates, which are influenced by the Fed Reserve Open Market Committee. That committee has signaled more hikes in the benchmark interest rate for 2018 and 2019. If wage inflation or CPI inflation were to surge higher, the Fed would be forced to raise rates even faster and the yield curve could invert.
Keep an eye on this reliable indicator for an early signal of the end of this expansion.
Hilliard MacBeth
The opinions expressed in this report are the opinions of the author and readers should not assume they reflect the opinions or recommendations of Richardson GMP Limited or its affiliates. Assumptions, opinions and estimates constitute the author's judgment as of the date of this material and are subject to change without notice. We do not warrant the completeness or accuracy of this material, and it should not be relied upon as such. Before acting on any recommendation, you should consider whether it is suitable for your particular circumstances and, if necessary, seek professional advice. Past performance is not indicative of future results. The comments contained herein are general in nature and are not intended to be, nor should be construed to be, legal or tax advice to any particular individual. Accordingly, individuals should consult their own legal or tax advisors for advice with respect to the tax consequences to them, having regard to their own particular circumstances.. Richardson GMP Limited is a member of Canadian Investor Protection Fund. Richardson is a trade-mark of James Richardson & Sons, Limited. GMP is a registered trade-mark of GMP Securities L.P. Both used under license by Richardson GMP Limited.