To quote from the opening sentence in Andrew Ang’s text on Asset Management, “The two most important words in investing are bad times”. Bad times can take on a variety of forms but in each case there is an appropriate risk measure to quantify how bad it really is.
We previously discussed rates of return. Once the data is available there is no ambiguity to historic returns, but risk looks to the future to quantify the range of potential outcomes. Investors want more return than risk, but the pursuit of the mythical free lunch can get us into trouble, with risks often only apparent when most inconvenient.
Uncertainty and risk are often considered synonymous but they are slightly different in the financial context: risk can be modelled because we have historical data to guide us, uncertainty is what could happen in the future that hasn’t happened in the past. The impact of climate change on capital markets is uncertain[1], investing in penny stocks is risky.
If you are worried about changes in portfolio value, accumulating enough to retire, income variability in retirement and outliving your money you are encountering risk. Each financial goal has its own measure of risk and we discuss some common risk measures.
Volatility
Over a single period, a risk to investing in markets is the risk of not getting the return we expected. If we expected a 5% return but realized -10% or +20% then this would be a +/-15% deviation from expectations. This naturally leads to the idea of volatility as a measure of return risk: the wider the range of possible outcomes the more volatile the investment. Stocks are more volatile than bonds because the outcome over any period is more uncertain. All other things being equal, investors prefer less volatility. Partly this is behavioural: investors dislike losses more than they value gains but also investors may want to access their money in the future and prefer the future value to be as predictable as possible.
A measure of volatility is the deviation from the mean return – the higher the deviation, the riskier the stock. Deviations from a mean might be positive or negative so simply adding the deviations over several periods could lead to a total close to zero if positive and negative deviations cancel each other out. This would be a misleading indicator that the stock is not very risky. Consequently, the variance, which is the square of the deviations is more useful as the variance is always a positive number. A shortcoming of variance is that it doesn’t distinguish between an unexpected positive return and an unexpected negative return of similar magnitude, although investors clearly prefer unexpected upsides to downsides. The square root of the variance is the standard deviation, and this is often reported in performance reports as an indication of the volatility of individual securities, assets and portfolios. When comparing two investments with similar returns, the one with the higher standard deviation has experienced a greater return volatility.
Beta
Another measure of volatility is Beta which is a measure of a security’s volatility relative to the overall market. Beta encompasses the idea that risk and return are related – surely stocks that are riskier than the overall market should have a higher future return? Alas, life is not that simple, and we will explore this in future blogs.
Shortfall risk
10 years ago I projected I would have $1 million in my retirement portfolio at age 65. Instead, I find that markets underperformed expectations and I only have $800,000, a shortfall of $200,000. I have experienced shortfall risk. Shortfall risk is different from volatility as it measures the probability of falling short of a target at the end of a period rather than volatility during the period. Using the wrong risk measure when making decisions can lead to poor outcomes. As one researcher states:
“It is widely believed that although stocks are risky in the short run, in the long run they are sure to outperform risk-free investments such as government bonds. This is a dangerous fallacy.”[2]
This fallacy is often called time diversification. Examples of this fallacy are:
- Young investors should own more stocks because they have a long investment horizon and they can be confident that they will outperform low risk investments such as GICs. There may be good reasons for holding a high percentage of stocks when young, but this is not one of them.
- Lifecycle or targeted retirement date funds claim to provide additional security over a balanced fund because they offer a glide path of progressively lower allocation to stocks. An example of such a glidepath is the rule of thumb that an appropriate allocation between stocks and bonds should be 100% stocks less one’s age as a percentage. Thus a 65-year-old should hold 35% stocks and 65% bonds. This not only leans on the time diversification fallacy but also ignores how well the investments have performed and their ability to match future liabilities.
Problems arise because investors (and the financial media) focus on average returns, rather than terminal wealth as a measure of success. It is well understood that stocks are riskier than bonds in the sense that stocks are more volatile. Stock investors reasonably expect higher compensation in the form of higher returns for the additional risk.
Historically the average annual return from US stocks has been around 9.5%[3]. Next year the annual return could be -7% or + 12% but over several years we would expect the average annual return to gravitate to the historical average. If I am saving for retirement over the next 20 years, I might feel confident that over such a long period, I should achieve an 8% average annual return. My calculator tells me that for every dollar invested, I will have $4.66 after 20 years. This is a mistake, confusing long term average returns, which become more certain with time, with the range of potential outcomes that become more uncertain with time. We will see how to quantify the risk that a stock portfolio underperforms a risk-free asset (GICs or short term-government bonds) but first we look at the historical record.
Land of the rising sun but falling markets
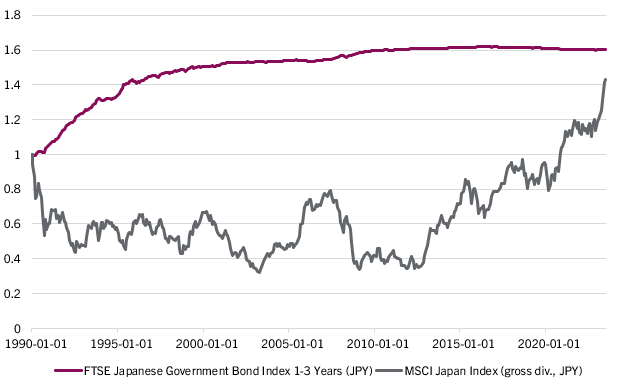
Consider the example of Japan. Figure 1 compares the Japanese stock market since 1990, as represented by the MSCI Japan Index, with short-term Japanese government bonds as a proxy for a risk-free asset. Over more than three decades the Japanese stock market underperformed the risk-free asset. The long-term average return of the Japanese stock market is 10.9%[4]. If a Japanese saver in 1990 had used the long-term average return for financial planning then after 20 years he would have anticipated 7.9 yen for every yen invested in the stock market but would have only realized 0.42 yen. By 2003 the Japanese stock market had lost nearly 70% of its value. Japan is a member of the G7, a grouping of the worlds advanced economies and has suffered no wars or other major disruption.
The Japanese experience is unusual in developed economies but reminds us that stock markets (not just individual stocks) can underperform bonds for a very long time. We show that this is not a bug but a feature of all stock markets.
Figure 1: Growth of 1 Japanese Yen (JPY) invested
1 Jan 1990-31 Jul 2023
Estimating Shortfall Risk
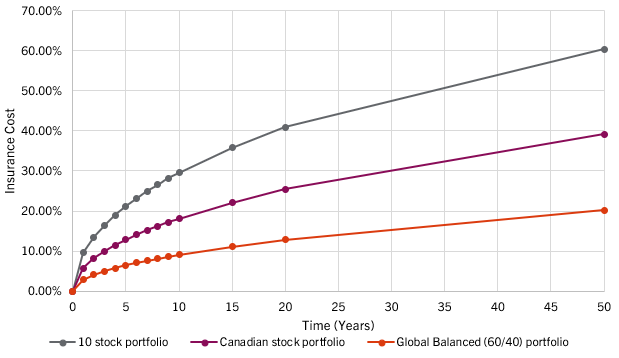
Market instruments exist that can insure against an investor against a stock price falling below a lower limit and is described by Zvi Bodie[5]. Using the same pricing methodology, we compute the cost of insurance to protect a portfolio against falling below the risk-free asset for a range of volatilities in Figure 2. The price of insurance is a measure of the shortfall risk. The illustrations are:
In all cases the cost of insurance increases with time, exposing the fallacy of time diversification. With an investment horizon of 20 years the relatively undiversified portfolio with 10 stocks would require an insurance cost of approximately 40% of the original investment. Over the same period, the insurance cost falls to 26% for the Canadian stock market and 13% for a globally diversified portfolio of 60% stocks and 40% bonds. The risk of shortfall increases with portfolio volatility and the investment period. In all cases the cost of insurance trends to %100 of every dollar invested as the time horizon stretches to infinity. This tells us the only way to be certain to get our dollar back after a very long exposure to the stock market is to match every dollar invested with a dollar in a risk-free asset.
Figure 2: Cost of insuring against shortfall as percentage of initial investment
Retail investors do not typically buy portfolio insurance. But knowing the price of something is the first step in assessing its value. To illustrate, suppose we are considering allocating $100 to an investment portfolio over 20 years and want to be confident that we outperform cash (the risk-free asset). If we compare the 100% Canadian stock portfolio with the global 60 equity, 40% bond portfolio we expect the average long-term return from the 100% equity portfolio to be higher but it also the most volatile so the insurance protection costs more.
| Option | Annualized standard deviation | Annualized return | Price of insurance | Amount invested | Initial capital | Expected wealth after 20 years |
| 100% Canadian stocks | 14.49% | 7.99% | $25.41 | $74.59 | $100.00 | $347.02 |
| Balanced portfolio | 7.23% | 7.62% | $12.84 | $87.16 | $100.00 | $378.60 |
Source: DFA Returns Web Canada and author’s calculations.
Table 1 calculates the price of insurance and deducts this from the initial capital and the remainder is invested for 20 years. Accounting for insuring against the risk of shortfall, the balanced portfolio has a higher expected wealth after 20 years.
This illustrates why we build diversified portfolios. They have lower volatility, offering a smoother ride to your destination, and a lower risk of shortfall at the end of the accumulation period. Chasing high returns without regard to the shortfall risk, even if you can tolerate the market volatility, may diminish the chance of achieving your wealth objective.
In Figure 2 we also showed the example of a 10-stock portfolio. An investor would choose a limited number of stocks if she believed that she could select stocks that could outperform the market. To match the expected wealth of a balanced portfolio, after accounting for insuring against shortfall risk, the required annualized return required from the 10-stock portfolio is 9.7%. In other words, the investor choosing 10 stocks would have to outperform the Canadian stock market on average by 1.7% annually for 20 years. This might seem a modest outperformance, but history doesn’t hold out much hope of sustaining this over two decades. The SPIVA data of historic fund performance we discussed here suggests only 15% of fund managers managed to beat the S&P/TSX at all over only 10 years.
In Part 2 of our risk blog we will consider retirees and a shortfall measure appropriate to their needs.