In 2025, volatility remains elevated compared to historical norms. The VIX index, often referred to as the market’s "fear gauge", reflects the expected 30-day volatility of the S&P 500. Higher readings suggest greater expected movement (in either direction), while lower readings indicate more stability.
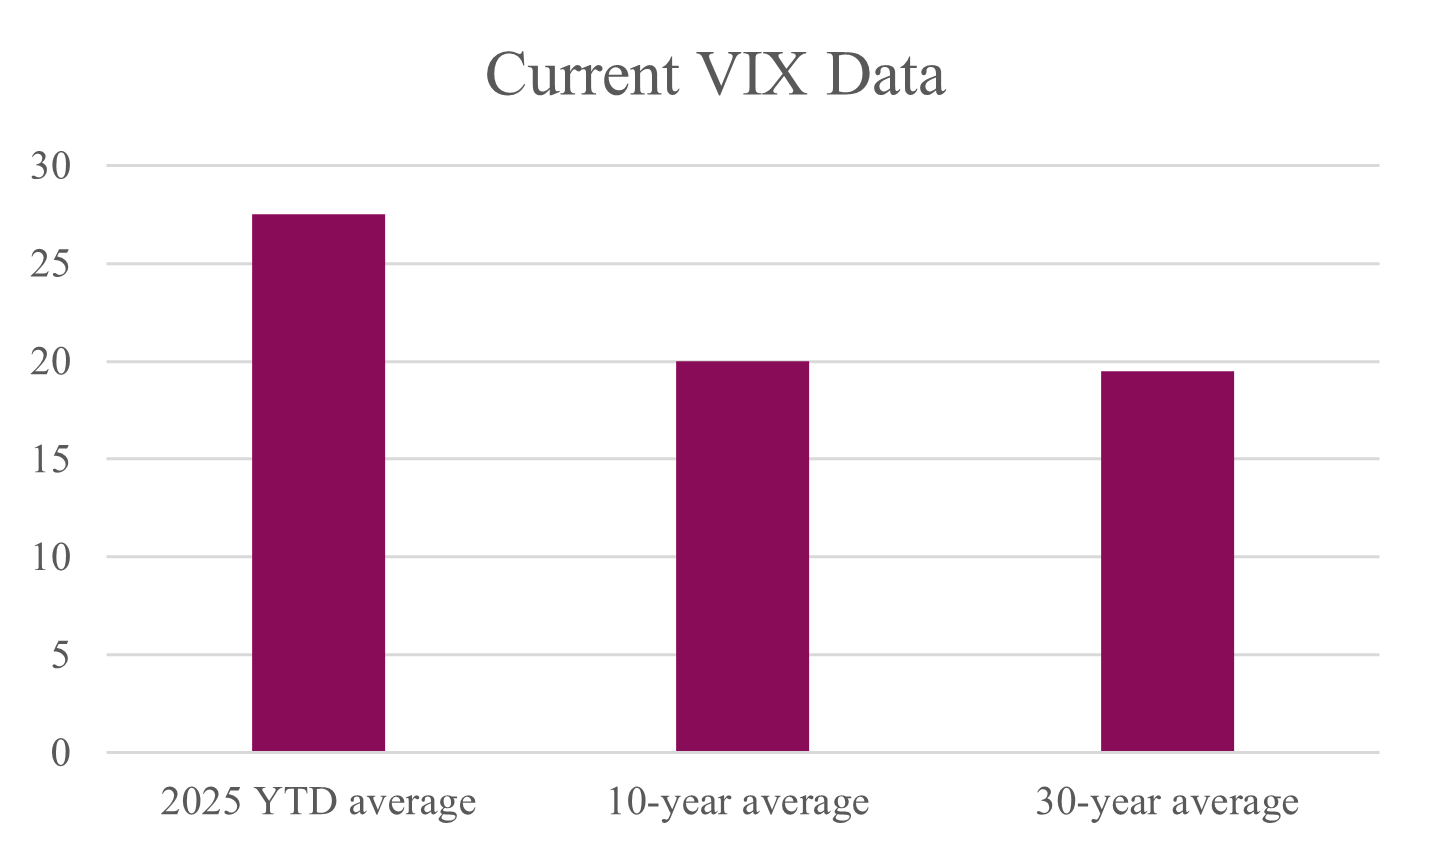
Source: CBOE (Chicago Board Options Exchange). 2025 data as of April 21st. 10- & 30-year average as of Dec. 31st, 2024.
This elevated VIX level in 2025 reflects ongoing investor uncertainty driven by tariffs, deglobalization trends, and inflation/interest rate uncertainty. For comparison, a VIX level above 20 is typically associated with increased risk perception.
Tariff-Driven Volatility vs. Past Market Shocks
2025 has seen a resurgence in trade-related volatility, echoing concerns from the U.S.-China trade war in 2018–2019. How does this volatility stack up historically?
| Event | Avg. VIX | Months VIX > 20 |
| Dot-Com Crash (2000–2002) | 25.6 | 28 |
| Financial Crisis (2008–2009) | 32.7 | 14 |
| U.S.-China Trade War (2018–2019) | 18.8 | 5 |
| COVID-19 Crisis (2020) | 29.3 | 6 |
| U.S. Tariffs (2025 YTD) | 27.5 | 3+ (ongoing) |
Source: CBOE. 2025 data as of April 21st.
While the VIX in 2025 isn’t at crisis-era highs, it has been elevated above normal levels (typically in the 19–20 range) for several months. At an average of 27.5, this recent spike reflects growing uncertainty around tariffs, supply chains, and global demand. However, unlike past events that kept volatility elevated for extended periods, such as the Dot-Com Crash or Financial Crisis, the current bout has been relatively short-lived so far. Markets are clearly pricing in more risk, but not yet signalling panic.
Another gauge of volatility is the standard deviation, which calculates historical price fluctuations. A higher standard deviation equals greater historical price fluctuations.
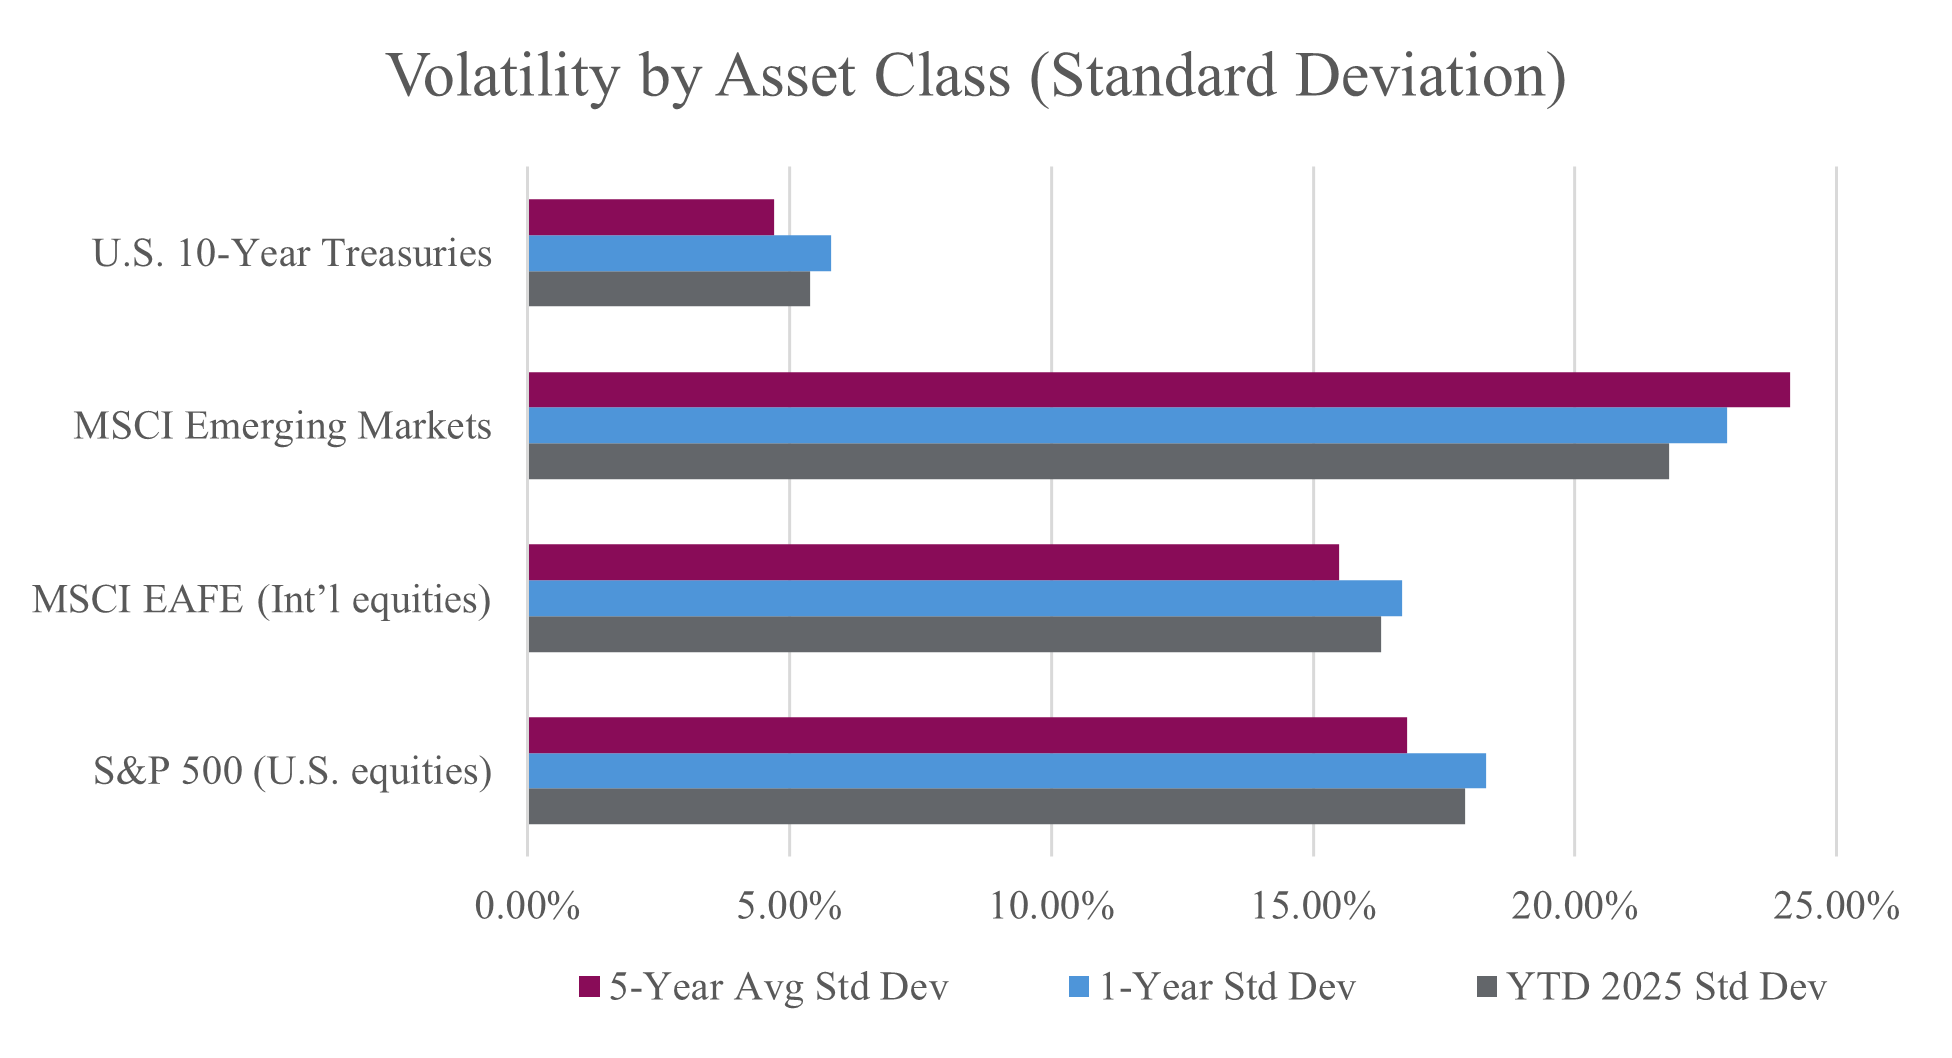
Source: Bloomberg; standard deviation calculated using monthly price returns, USD basis. 2025 data as of April 15th. 1- & 5-year Avg Std Dev as of Dec. 31st, 2024.
Emerging markets continue to show the highest volatility, reflecting higher political and economic uncertainty. U.S. Treasuries remain a stabilizing force, offering relatively low volatility.
Global Volatility Then and Now
Since the 1990s, globalization has transformed capital markets. Capital now moves across borders in seconds, and economies are more interlinked than ever. This integration initially dampened local volatility but has increased systemic volatility during global shocks.
According to research from the IMF and Bank for International Settlements (BIS), increased financial interdependence means market shocks spread more rapidly. In recent decades, we've seen faster, more synchronized global responses to economic events.
Despite the speed and synchronization of global responses, markets aren’t necessarily more volatile than in the past when looking at a longer time period.
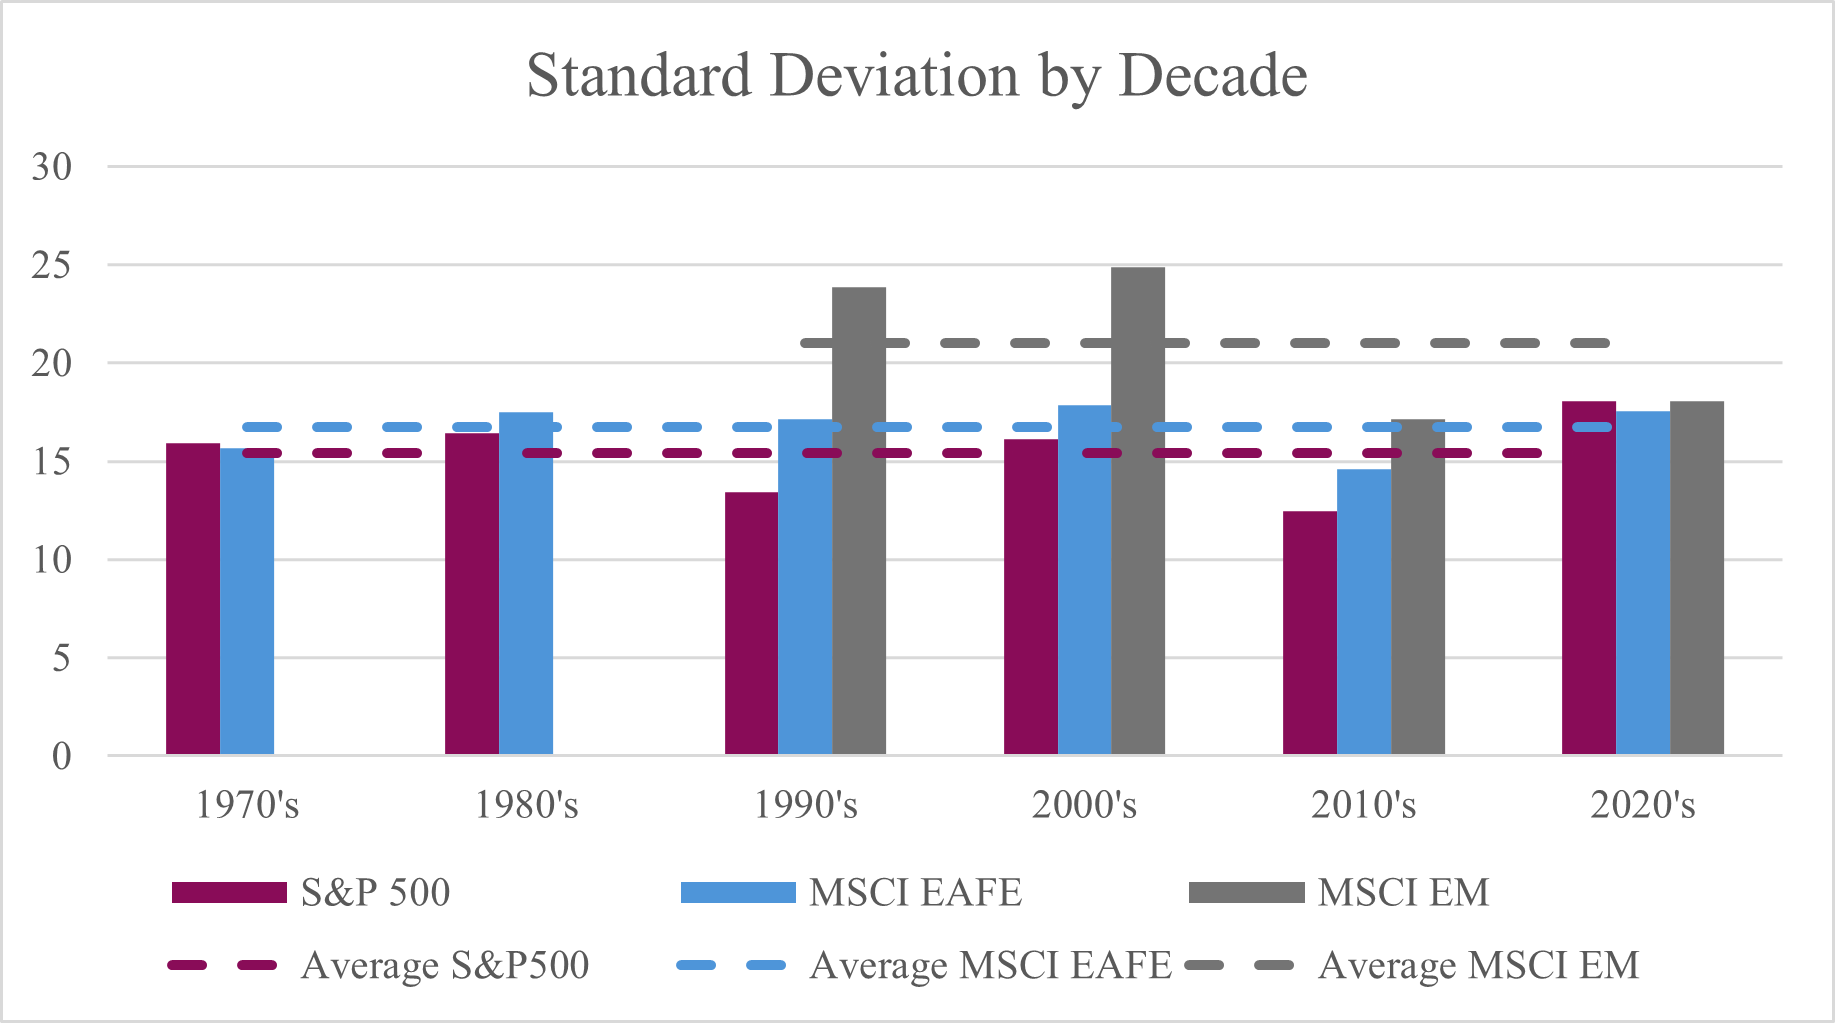
Source: DFA Returns, USD Basis, Data until March 31, 2025
We can see that the standard deviation of various markets fluctuates over decades. The U.S.’s standard deviation is currently heightened, but international markets (MSCI EAFE) are hovering around average and Emerging Markets are lower than the past.
However, the low volatility and high returns of the 2010’s may have lulled U.S. investors into a false sense of security. Despite the higher standard deviation for the first few years of the current decade, returns are still above average. Higher volatility does not equal lower returns.
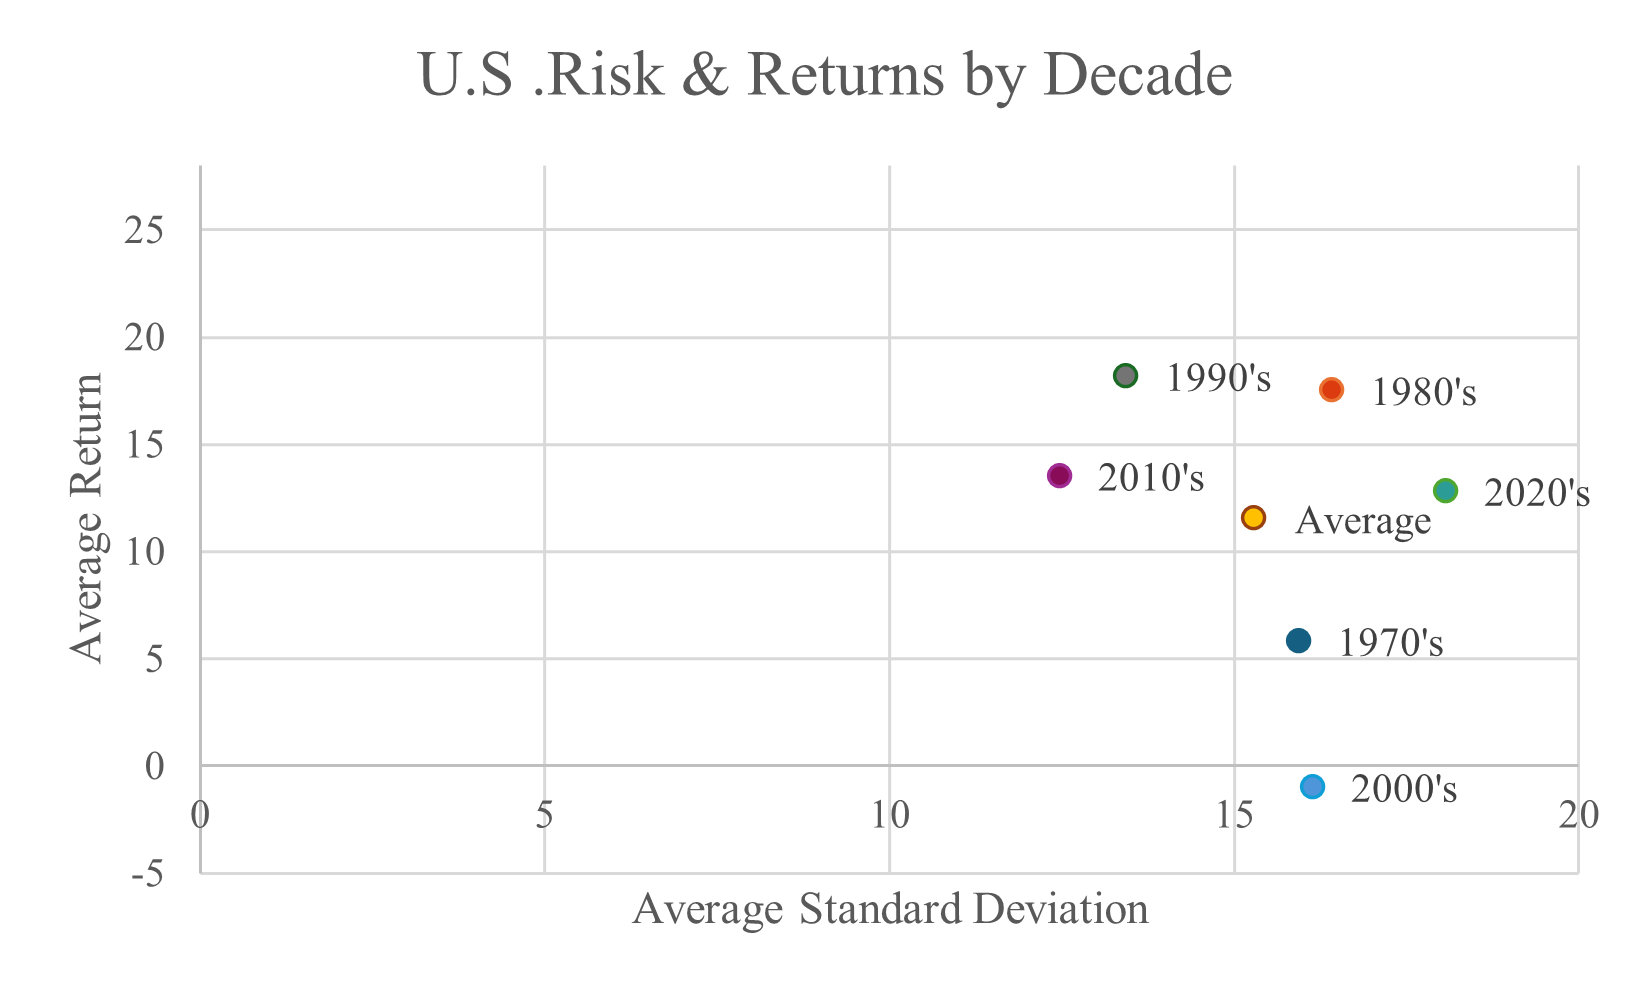
Source: DFA Returns, S&P 500 Data, USD Basis, Data until March 31, 2025
How Much Does the U.S. Influence Global Volatility?
The US plays a disproportionately large role in the global economy:
• U.S. share of global GDP: ~25%
• U.S. share of global public stock markets: ~61%
• U.S. dollar share of global reserves: ~59%
• S&P 500 companies with international revenue exposure: ~40%
Source: World Bank, IMF, S&P Global Market Intelligence, Dimensional Fund Advisors; USD basis.
Global markets often take cues from U.S. events, especially during crises. To illustrate this, let’s compare peak-to-trough drawdowns across four major global market shocks.
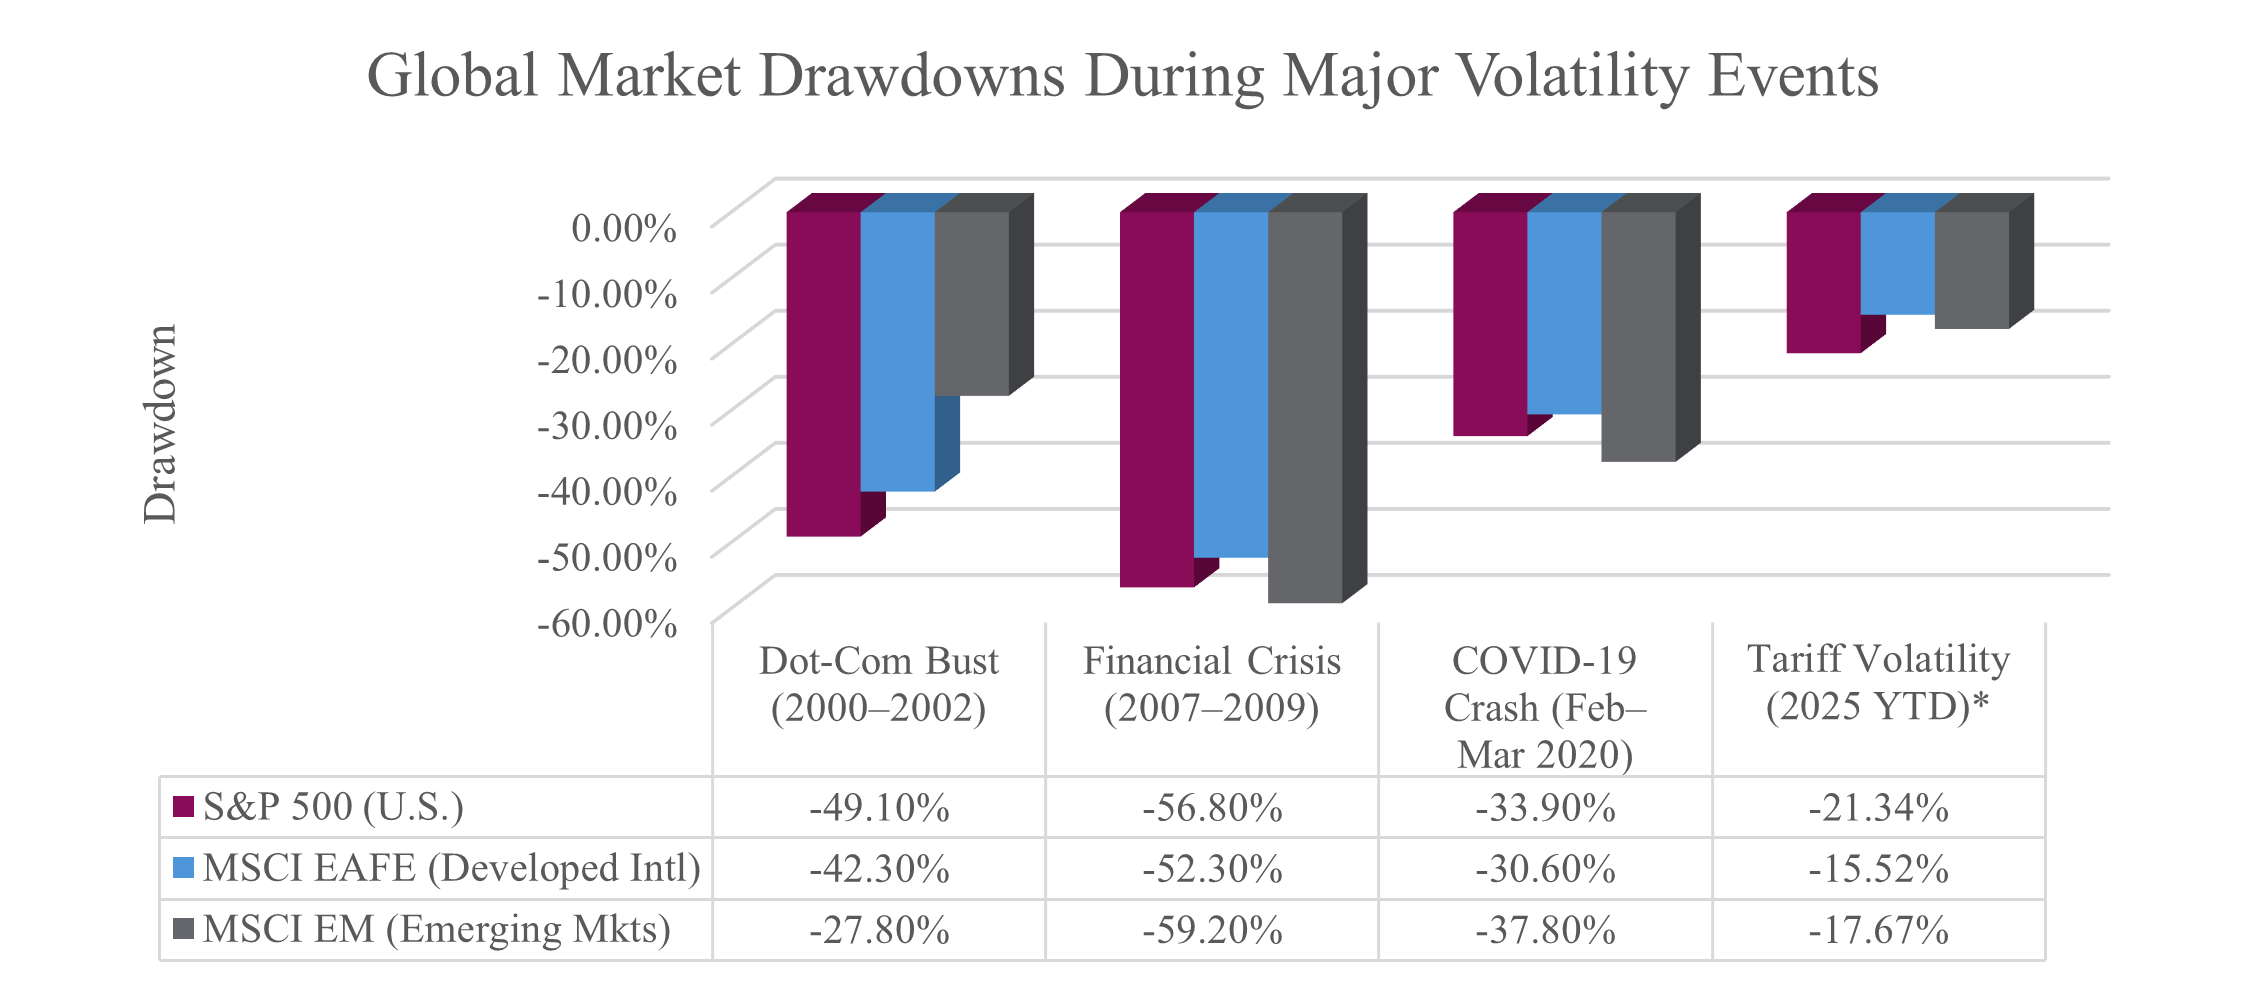
Source: Bloomberg. All drawdowns measured in USD terms based on global index proxies (e.g., MSCI ACWI, S&P 500, etc.). Drawdowns measured from all-time highs to YTD lows.
Despite the Dot-Com Bust and Financial Crisis largely stemming from the U.S., the effects rippled throughout global markets. While the tariffs are targeted across the globe, the decisions by a single government are impacting the rest of the world. When the U.S. sneezes, the world catches a cold. U.S. markets are deeply tied to global liquidity, trade, and sentiment.
The U.S. is currently pursuing a more protectionist, inward-focused economic policy, rising tariffs, reduced global trade engagement, and reshoring of manufacturing. Even if the U.S. withdraws somewhat from global trade, its economic and monetary policy, corporate earnings, and investor sentiment still drive capital flows worldwide. In the near term, isolation may increase volatility due to supply chain disruptions and trade retaliation.
How to Overcome Global Volatility
Volatility is a natural part of investing. While headlines can amplify short-term fear, markets have historically rewarded those who stay the course. The key isn’t to avoid volatility but to build a resilient portfolio that can weather uncertainty and participate in long-term global growth.
The Power of Global Diversification
A globally diversified, passive investment strategy spreads risk across regions, sectors, and asset classes. This approach helps reduce portfolio volatility by avoiding concentration in any single asset class, geographical market or economic outcome.
Diversification doesn’t guarantee the elimination of short-term losses, but it helps to reduce the impact of volatility across regions and sectors. However, given the increased interconnectedness of global markets today, regional downturns or shocks can quickly ripple through multiple geographies making it harder to avoid simultaneous declines in equity markets.
Which Assets Help During High Volatility?
While global diversification is important when investing in equities, diversifying across asset classes also mitigates volatility. Let’s look at how different asset classes have historically performed during periods of heightened volatility, defined here as times when the VIX Index is above 25 (well above the long-term average of ~19.4):
Asset Returns When VIX > 25:
| Asset Class | Avg Return |
| Gold | +8.5% |
| Value Stocks | +4.5% to +5.5% |
| U.S. Treasuries (10Y) | +4.1% |
| High-Dividend Stocks | +2.9% |
| Broad Equity Indexes | -3.7% |
Source: J.P. Morgan Guide to the Markets (2024 edition), Bloomberg. Based on monthly USD returns during high-VIX periods (VIX > 25) Data as of VIX introduction in 1990 to Dec 31st, 2024.
While broad equities can suffer during high-volatility periods, fixed income and gold often act as stabilizers. Value stocks can also mitigate the volatility experienced by broad equity markets. Holding a mix of assets can help cushion the impact of short-term drawdowns while positioning your portfolio for long-term recovery.
Staying Passive and Staying Invested
Trying to time the market or jump in and out of volatile periods often leads to worse outcomes. According to a J.P. Morgan study (2004–2024), an investor who remained fully invested in the S&P 500 earned an annualized return of 9.9%. Missing just the 10 best trading days reduced returns to 5.5%—cutting portfolio growth almost in half.
Source: J.P. Morgan Asset Management, 2024 Guide to Retirement.
Note for Canadian investors: Returns are in USD; CAD-based returns would vary based on FX movements, but the takeaway on investor behaviour is universal.
A passive, globally diversified strategy:
• Keeps costs low
• Helps investors stay disciplined and avoid emotional decisions (like panic selling)
• Ensures consistent exposure to long-term growth trends across sectors and economies
Final Thoughts
Volatility is a natural part of investing. While it can be unsettling, the key to success is maintaining focus on your long-term financial goals and avoiding the temptation to react to short-term market swings.
Tune Out the Doom and Gloom Media
In times of market turmoil, the media often amplifies fear with sensational headlines. This can cause emotional decisions, such as selling during downturns or chasing the latest trends during bull markets. It’s important to tune out the noise and remember that volatility is normal, and market corrections are often temporary.
• Media thrives on sensationalism, but short-term volatility doesn’t change the fundamentals.
• Emotional decisions based on fear or greed can hurt long-term returns.
• Focus on your strategy, not the headlines.
Staying Focused on Your Long-Term Strategy
Market corrections are often temporary, and downturns can provide chances to buy quality assets at a discount or rebalance your portfolio. Stick to your plan, remain disciplined, and use market fluctuations to your advantage. By staying calm, focused, and ignoring the headlines, you can weather volatility and emerge with a stronger portfolio over time.
Note: All references to the VIX and equity benchmarks are in USD, based on U.S. market data unless otherwise stated.
The opinions expressed in this report are the opinions of the author and readers should not assume they reflect the opinions or recommendations of Richardson Wealth Limited or its affiliates. Assumptions, opinions and estimates constitute the author’s judgment as of the date of this material and are subject to change without notice. Richardson Wealth Limited does not warrant the completeness or accuracy of this material, and it should not be relied upon as such. Before acting on any recommendation, you should consider whether it is suitable for your particular circumstances and, if necessary, seek professional advice. Past performance is not indicative of future results. Richardson Wealth is a member of Canadian Investor Protection Fund. Richardson Wealth is a trademark by its respective owners used under license by Richardson Wealth.